Bitcoin traders are again staring at a chart structure that resembles the setup that preceded the market’s roughly 30% drop from late January into early February. But several order-flow analysts argue the comparison is incomplete, because the underlying spot-book picture looks materially stronger this time.
Will The 30% Bitcoin Crash Repeat?
That debate picked up on March 24 after analyst Exitpump (@exitpumpBTC) posted a chart comparing the current range with the earlier breakdown zone. The visual similarity is hard to miss: in both cases, BTC traded inside a defined consolidation before slipping into the lower end of the structure.
In the earlier episode from January 29 to February 5, that pattern gave way to a sharp -30% move into the low-$60,000s. In the current one, Bitcoin was trading around the $70,000 area, with price again sitting near a vulnerable-looking part of the range.
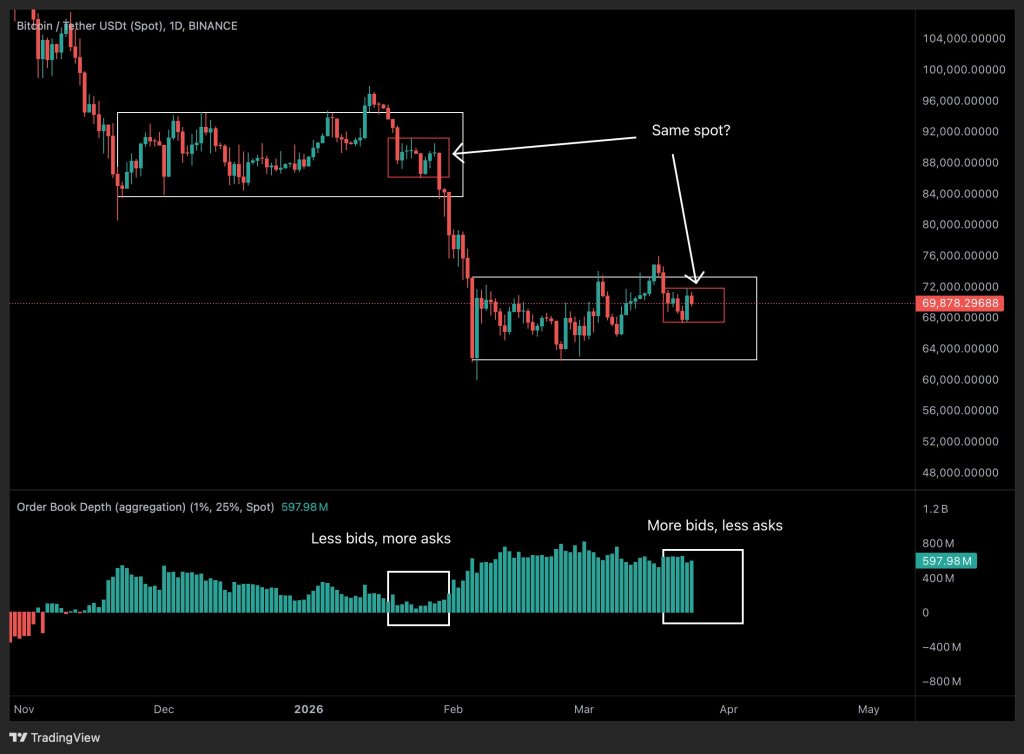
Exitpump’s core argument is that the resemblance in price structure masks a key difference in liquidity. “I see people are comparing current spot to previous range and what many are missing here is that now aggregated spot orderbooks have way more passive demand than they had in the previous range,” he wrote. “Dump to low $60Ks is okay, acceptable, but not expecting bigger downtrend while such passive demand stays.”
That distinction matters because the chart he shared suggests the market is not entering this setup with the same thin bid support seen before the earlier flush. In his framing, the prior range featured fewer resting bids and more overhead asks. The current range, by contrast, shows thicker spot-book demand and relatively lighter sell-side pressure, implying that even if BTC revisits the lows, the path to a deeper trend breakdown may be less straightforward.
Exitpump also pushed back on the idea that this type of deeper spot-book liquidity is easily manipulated. After one user asked whether spoofing is common in aggregated order-book data, he replied: “deeper depth spot orderbooks don’t spoof, those bids sit there for weeks or even months.” That is a consequential point in the context of the trade. If the demand visible in the book is genuine and sticky rather than tactical and fleeting, then the market may have a stronger absorption layer beneath price than it did during the January-February slide.
Still, the short-term flow picture is not cleanly bullish. In a separate post, Exitpump said the order books had “flipped bearish,” adding that “yesterday was better, but looks like momentum to the upside is fading away.” He also flagged positioning risk, saying open interest RSI was near an extreme and that “chances of longs unwind has increased.”
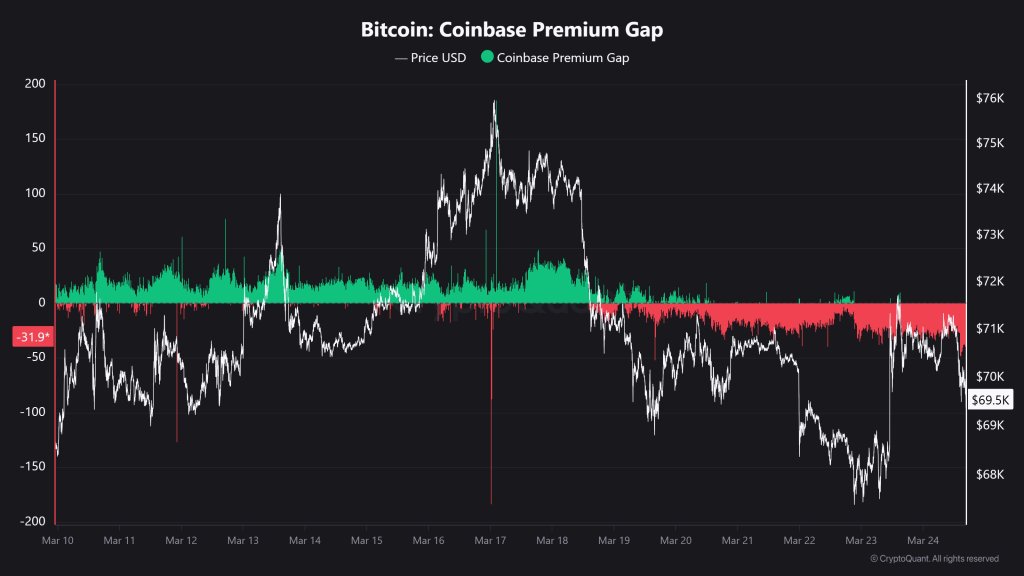
Other market watchers pointed to the same deterioration from different angles. Maartunn (@JA_Maartun) noted that the Coinbase Premium Gap had turned negative again, a sign that Coinbase spot demand was lagging.
Zord’s (@ZordXBT) read was more explicitly cautious: “Funding stays positive + Volume is down + Coinbase in deep red territory. Not going to lie, price wise the chart looks like it wants to continue but orderflow wise, things are looking like distribution.”
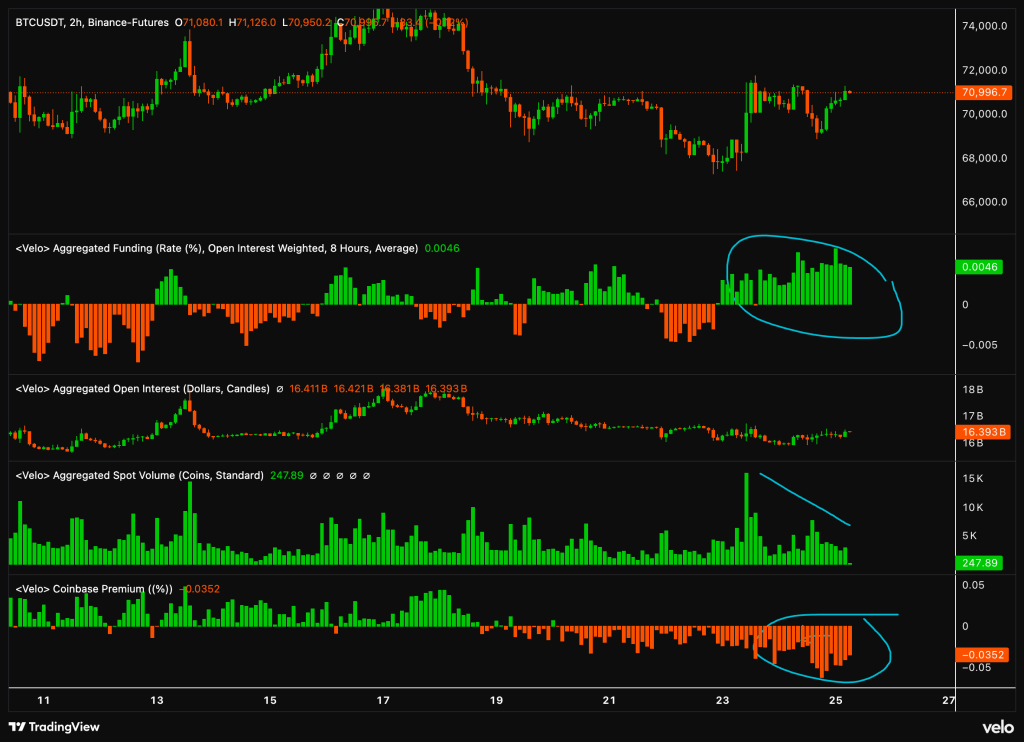
He then laid out what would need to improve to make the move more convincing. “Maybe some more volume + Coinbase in green would be good. Funding slightly down will be cherry on the cake.”
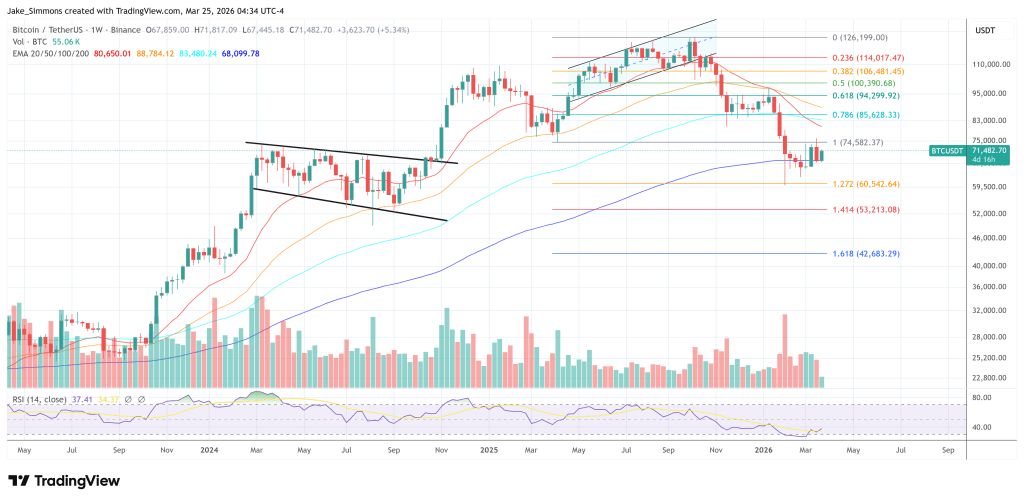
At press time, BTC traded at $71,482.


 English (US) ·